A month ago I’ve written HTML2GDL script that creates the graph of a html file/url for aiSee graph layout software. Recently I found another graph package GraphViz, and I decided to add support for DOT language into HTML2GDL. GraphViz and aiSee have different layout algorithms. I wanted to compare the graphs produced by similar layouts offered by both packages and try the new ones available to GraphViz only (the radial and circular layouts).
A new command line parameter was introduced: --engine=[GraphViz, aiSee], the default is aiSee, so don’t forget to use html2gdl as follows:
html2gdl.pl --engine=GraphViz --url=http://site.com --graph=output.gv
Download the HTML2GDL script:
For information on HTML2GDL usage read HTML as graphs: the HTML2GDL application.
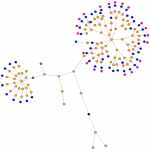
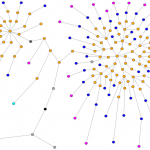
I’ll provide a few graph samples and screenshots at first. Let’s see the graphs of http://www.graphviz.org/Gallery.php.
> perl html2gdl.pl --engine=GraphViz --url=http://www.graphviz.org/Gallery.php --node-radius=size --node-color=tag --graph=graphviz1_left.gv

> neato -Tpng -ograph1.png graphviz1_left.gv
GV source (The graph on the left)
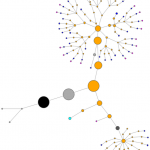
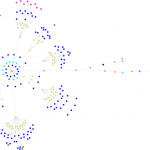
> perl html2gdl.pl --engine=GraphViz --url=http://www.graphviz.org/Gallery.php --node-radius=level --node-color=size --graph=graphviz1_center.gv

> neato -Tpng -ograph2.png graphviz1_center.gv
GV source (The graph in the middle)
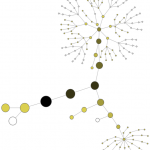
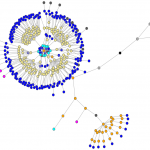
> perl html2gdl.pl --engine=GraphViz --url=http://www.graphviz.org/Gallery.php --node-radius=level --node-color=tag --graph=graphviz1_right.gv

> dot -Tpng -ograph3.png graphviz1_right.gv
GV source (The graph on the right)
A few command line options were introduced for –engine=GraphViz:
--edge-len-min=float default: 0.15
--edge-len-max=float default: 0.8
The length of an edge varies in the [edge-len-min .. edge-len-max] interval depending on node level. The deeper the nodes, the shorter the edge. The length of an edge gradually decreases with its length up to --edge-len-max-level. Below that level all edges will have len=--edge-len-min.
By default: --edge-len-max-level=9.
You can also control the labels of the nodes:
--show-labels=[0,1,2]
- 0: no labels
- 1: nodes are labeled with their tag names: ‘p’, ‘span’
- 2: css ID and class will be added to the tag: ‘div#header.red’
Note that in the default graph header node[fixedsize=true] is specified. It means that the size of a node doesn’t depend on the length of its label.
Here is a list of graph attributes that you might find useful, refer to GraphViz documentation for more info:
maxiter: Sets the number of iterations used;model: This value specifies how the distance matrix is computed for the input graph;mode: Technique for optimizing the layout;nodesep: Minimum space between two adjacent nodes in the same rank, in inches;size: Maximum width and height of drawing, in inches;overlap: Determines if and how node overlaps should be removed;outputorder: Specify order in which nodes and edges are drawn: [breadthfirst, nodesfirst, edgesfirst];size: Maximum width and height of drawing, in inches. Note that there is some interaction between the size and ratio attributes;ratio: Sets the aspect ratio (drawing height/drawing width) for the drawing. Note that this is adjusted before the size attribute constraints are enforced;root: This specifies node/nodes to be used as the center of the layout and the root of the generated spanning tree. Important forcircoandtwopilayouts.
In the documentation about overlap, I read about overlap=”ipsep”, but the following options used with neato layout didn’t worked. Neato issued a Warning: Unhandled adjust option ipsep.
graph HMTL {
overlap=”ipsep”;
mode=ipsep;
…
By setting overlap="false";, node overlaps are removed by a Voronoi-based technique. But it rather distorts the graph instead of making it look more attractive. Compare the graphs of http://www.graphviz.org/Gallery.php: the left one doesn’t have an overlap specified (the default). The graph on the right has overlap=false;.
Be aware that in aiSee node dimensions are in pixels, while for GraphViz these are in inches. If nodes will be bigger than the edges’ length (for ex. --radius-size=20 along with the default --edge-len-max=0.9), it will require more time (and sometimes it can last forever) to render the graph.
GraphViz can draw a graph using the following laouts:
dot: The default GraphViz layout for directed graph layouts;neato: For undirected graph layouts – spring model;twopi: For undirected graph layouts – radial;circo: For undirected graph layouts – circular;fdp: For undirected graph layouts – force directed spring model.
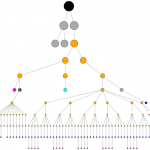
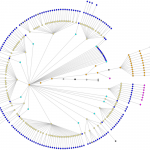
I read the docs carefully, but didn’t find how to control the edges’ length for fdp layout. The resulting PNG images had widths/heights bigger then 3000px. Here is a resized fdp output (left image) with the same graph rendered by neato in the middle. url: http://www.graphviz.org/Resources.php. The same graph is displayed on the right using the twopi layout.
For more information on HTML2GDL usage read HTML as graphs: the HTML2GDL application.
